Sudden Ionospheric Disturbances
Page 2
Ron Fleshman KB2VIV
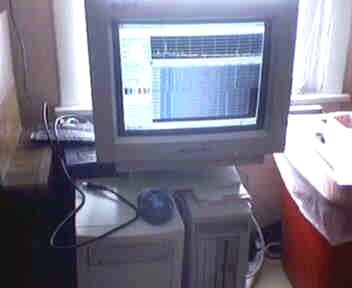
My VLF software receiver
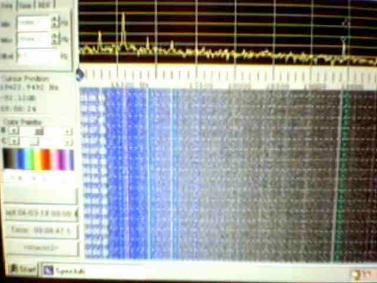
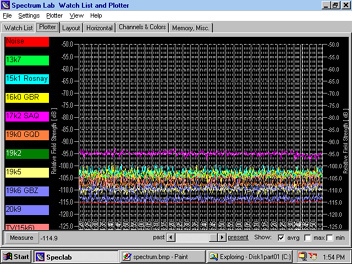
Main screen of Spectrum Lab
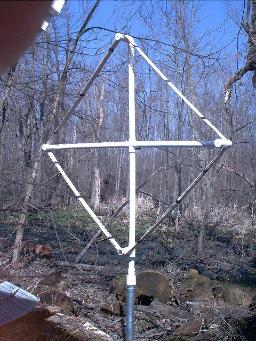
SIDS Receiver and Antenna
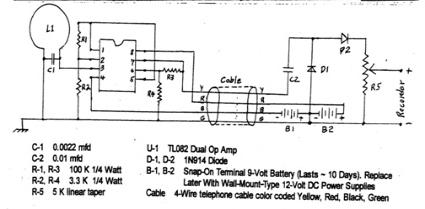
All most all SIDs monitoring stations are home built by the observers. The schematic for a simple receiver designed by Casper
Hossfield, can be found on many sites and is shown above. A resonant loop antenna (L1, C1) feeds a dual TL082 OP amp. The OP
amp increases the signal strength about 900 times. Total power of the signal is detected by and rectified by diodes D1 & D2, C2
keeps DC voltages out of the detector this prevents DC offsets in the output signal. The resultant DC voltage is then fed into a strip
recorder or digitized and fed into a logging program on a computer. I am using radio sky pipe as a logging program. This program not
only permits logging on the computer but also allows the resulting files to be shared over the internet with other observers. The
antenna is 21 turns of #14 wire wound on a form made from 11/4 inch PVC pipe. The arms on the form are 5 feet out side edge to
outside edge. The loop is tuned by capacitor C1. Values for C1 for popular frequencies are shown in the following table.
Frequency Capacitance Station
kHz ufd
21.4 .0346 NPM Hawaii
24 .0276 NAA Cutler Maine
24.8 .0257 Tim Creek WA.
26.1 .0233
27 .0218
30.6 .0166
These are approximate values, different construction techniques of the loop may cause them to be slightly different. C1 and the OP
amp are mounted on the loop itself using a small box from Radio Shack. I had to use shielded wire from the antenna to the detector
because the loop would pick up the signal. this feed back would cause oscillations.
Once the receiver and antenna are built, it is important to monitor the received signal for a few days. The signal should show the
characteristic variations in signal strength with the rising and setting of the sun. This shows that the signal is being propagated by the
ionosphere. If the signal is a straight line, try rotating the antenna, using a different station, or varying the values of resistors R1 and
R3. These resistors control the gain of the OP amp. Once your signal shows night and day signal strength variations you are ready to
start recording. Data can be shared with AAVSO and their solar and SID observation network.